Optimizing Oracle Optimizer (2011년)
Index Range SCAN
- Index Range Scan 으로 데이터 추출하는 실행계획
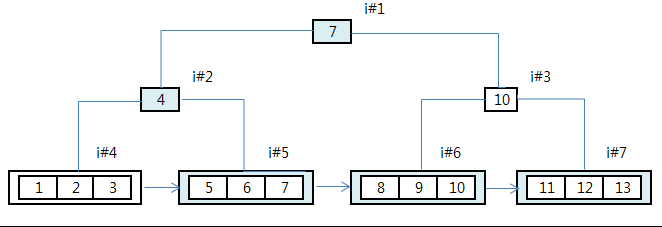
- c1 >= 5 조건에 해당하는 Key 값을 찾기 위해 Index root block (i#1) 와 Branch Block (i#2) 을 탐색한다. Logical Read 가 2 가 증가.
- c1 >= 5 조건을 만족하는 첫번째 leaf block (i#5)를 방문 Logical read 1 증가 조건에 맞는 6,7 을 추출해서 Retrun 한다.
- 다음번 key 7 을 추출하기 위해 Leaf Block (i#6)를 방문 Logical read 1 증가Key 7,8,9 추출해서 Retun 한다 이 과정을 탐색이 끝날 때 까지 계속한다.
- 일반적으로 Oracle 은 Leaf Block 에 속한 Key 값을 한번에 읽어 들인다.
- 그럼 Logical read = Leaf Block !? 동일하다 확인해 보자~
SQL> create table t1(c1 int, c2 int);
SQL> create index t1_c1 on t1(c1);
SQL> insert into t1
  2  select level , level from dual
  3  connect by level <= 10000;

10000 rows created.

SQL> exec dbms_stats.gather_table_stats('JIN','T1');
PL/SQL procedure successfully completed.

SQL> explain plan for
  2  select /*+ index(t1) */
  3    c1
  4  from t1
  5  where c1 >= 5
  6  ;

Explained.
--------------------------------------------------------------------------
| Id  | Operation        | Name  | Rows  | Bytes | Cost (%CPU)| Time     |
--------------------------------------------------------------------------
|   0 | SELECT STATEMENT |       |  9997 | 39988 |    20   (0)| 00:00:01 |
|*  1 |  INDEX RANGE SCAN| T1_N1 |  9997 | 39988 |    20   (0)| 00:00:01 |
--------------------------------------------------------------------------

select /*+ gather_plan_statistics index(t1) */   c1 from t1 where c1 >= 5

-------------------------------------------------------------------------------------------------
| Id  | Operation        | Name  | Starts | E-Rows | Cost (%CPU)| A-Rows |   A-Time   | Buffers |
-------------------------------------------------------------------------------------------------
|*  1 |  INDEX RANGE SCAN| T1_N1 |      1 |   9997 |    20   (0)|   9996 |00:00:00.02 |     686 |
-------------------------------------------------------------------------------------------------
여기서 의미하는 Logical Read 는 어디에서 나왔을까!?
SQL> @dic t1_n1
OWNER                         : JIN
INDEX_NAME                    : T1_N1
INDEX_TYPE                    : NORMAL
TABLE_OWNER                   : JIN
TABLE_NAME                    : T1
TABLE_TYPE                    : TABLE
UNIQUENESS                    : NONUNIQUE
COMPRESSION                   : DISABLED
PREFIX_LENGTH                 :
TABLESPACE_NAME               : USERS
INI_TRANS                     : 2
MAX_TRANS                     : 255
INITIAL_EXTENT                : 65536
NEXT_EXTENT                   :
MIN_EXTENTS                   : 1
MAX_EXTENTS                   : 2147483645
PCT_INCREASE                  :
PCT_THRESHOLD                 :
INCLUDE_COLUMN                :
FREELISTS                     :
FREELIST_GROUPS               :
PCT_FREE                      : 10
LOGGING                       : YES
BLEVEL                        : 1
LEAF_BLOCKS                   : 19
DISTINCT_KEYS                 : 10000
AVG_LEAF_BLOCKS_PER_KEY       : 1
AVG_DATA_BLOCKS_PER_KEY       : 1
CLUSTERING_FACTOR             : 18
STATUS                        : VALID
NUM_ROWS                      : 10000
SAMPLE_SIZE                   : 10000
LAST_ANALYZED                 : 22-MAR-11
DEGREE                        : 1
INSTANCES                     : 1
PARTITIONED                   : NO
TEMPORARY                     : N
GENERATED                     : N
SECONDARY                     : N
BUFFER_POOL                   : DEFAULT
USER_STATS                    : NO
DURATION                      :
PCT_DIRECT_ACCESS             :
ITYP_OWNER                    :
ITYP_NAME                     :
PARAMETERS                    :
GLOBAL_STATS                  : YES
DOMIDX_STATUS                 :
DOMIDX_OPSTATUS               :
FUNCIDX_STATUS                :
JOIN_INDEX                    : NO
IOT_REDUNDANT_PKEY_ELIM       : NO
DROPPED                       : NO

select /*+ gather_plan_statistics index(t1) */   count(*) from t1 where c1 >= 5

--------------------------------------------------------------------------------------------------
| Id  | Operation         | Name  | Starts | E-Rows | Cost (%CPU)| A-Rows |   A-Time   | Buffers |
--------------------------------------------------------------------------------------------------
|   1 |  SORT AGGREGATE   |       |      1 |      1 |            |      1 |00:00:00.01 |      20 |
|*  2 |   INDEX RANGE SCAN| T1_N1 |      1 |   9997 |    20   (0)|   9996 |00:00:00.02 |      20 |
Rootblock + Leafblock = 20
- 즉 한번의 Fetch 만 LeafBlock 을 Range SCAN 하는 경우 LeafBlock 의 수 만큼 Read가 발생한다.
- 이말을 반대로 해색하면 FetchCall 단위가 바뀔 때마다 매번 Block 을 로 일거야 한다.
- SQL Plus 의 Fetch array size 는 15 이다. 9996 의 row를 읽을라면 9996/15 = 666 (추가방문) + 20(leaf block) 수. 686 이 Logical Read 의 수가 된다.
Fetch Array Size 값에 따른 변화
Fetch Array Size

select /*+ gather_plan_statistics index(t1) */   c1 from t1 where c1 >= 5

set arraysize 1
-------------------------------------------------------------------------------------------------
| Id  | Operation        | Name  | Starts | E-Rows | Cost (%CPU)| A-Rows |   A-Time   | Buffers |
-------------------------------------------------------------------------------------------------
|*  1 |  INDEX RANGE SCAN| T1_N1 |      1 |   9997 |    20   (0)|   9996 |00:00:00.02 |    5009 |
-------------------------------------------------------------------------------------------------
set arraysize 2
-------------------------------------------------------------------------------------------------
| Id  | Operation        | Name  | Starts | E-Rows | Cost (%CPU)| A-Rows |   A-Time   | Buffers |
-------------------------------------------------------------------------------------------------
|*  1 |  INDEX RANGE SCAN| T1_N1 |      1 |   9997 |    20   (0)|   9996 |00:00:00.02 |    5009 |
-------------------------------------------------------------------------------------------------
set arraysize 15
-------------------------------------------------------------------------------------------------
| Id  | Operation        | Name  | Starts | E-Rows | Cost (%CPU)| A-Rows |   A-Time   | Buffers |
-------------------------------------------------------------------------------------------------
|*  1 |  INDEX RANGE SCAN| T1_N1 |      1 |   9997 |    20   (0)|   9996 |00:00:00.02 |     686 |
-------------------------------------------------------------------------------------------------
set arraysize 100
-------------------------------------------------------------------------------------------------
| Id  | Operation        | Name  | Starts | E-Rows | Cost (%CPU)| A-Rows |   A-Time   | Buffers |
-------------------------------------------------------------------------------------------------
|*  1 |  INDEX RANGE SCAN| T1_N1 |      1 |   9997 |    20   (0)|   9996 |00:00:00.02 |     119 |
-------------------------------------------------------------------------------------------------
set arraysize 1000
-------------------------------------------------------------------------------------------------
| Id  | Operation        | Name  | Starts | E-Rows | Cost (%CPU)| A-Rows |   A-Time   | Buffers |
-------------------------------------------------------------------------------------------------
|*  1 |  INDEX RANGE SCAN| T1_N1 |      1 |   9997 |    20   (0)|   9996 |00:00:00.02 |      30 |
-------------------------------------------------------------------------------------------------
Fetch Array Size 값이 Index Range Scan 의 Leaf Block 방문 제한 회수를 제한한다.
 statistics

NAME                                           VALUE1       VALUE2         DIFF
---------------------------------------- ------------ ------------ ------------
bytes sent via SQL*Net to client              983,370       58,212     -925,158
session pga memory                            720,896      -65,536     -786,432
session uga memory                            457,856      -65,408     -523,264
session uga memory max                              0      136,320      136,320
bytes received via SQL*Net from client         57,343        2,387      -54,956
SQL*Net roundtrips to/from client               5,013           17       -4,996
user calls                                      5,019           23       -4,996
consistent gets                                 5,031           51       -4,980
consistent gets from cache                      5,031           51       -4,980
buffer is not pinned count                      5,009           30       -4,979
no work - consistent read gets                  5,018           39       -4,979
session logical reads                           5,050          102       -4,948
redo size                                       3,176        3,328          152
undo change vector size                         2,384        2,420           36
db block changes                                   30           62           32
db block gets                                      19           51           32
db block gets from cache                           19           51           32
consistent changes                                 19           50           31
CPU used when call started                         21            7          -14
CPU used by this session                           20            7          -13
DB time                                            19            7          -12
free buffer requested                               0            9            9
enqueue releases                                    4            9            5
session cursor cache hits                           5            9            4
heap block compress                                 4            0           -4
enqueue requests                                    7            9            2
cleanout - number of ktugct calls                   4            2           -2
consistent gets - examination                       5            3           -2
active txn count during cleanout                    4            2           -2
redo entries                                       11           12            1
parse time cpu                                      1            2            1
recursive cpu usage                                 2            1           -1
hot buffers moved to head of LRU                    0            1            1
calls to kcmgcs                                     4            5            1
parse time elapsed                                  1            2            1

 time model

STAT_NAME                                      VALUE1       VALUE2         DIFF
---------------------------------------- ------------ ------------ ------------
DB CPU                                        154,296       56,628      -97,668
DB time                                       157,144       67,277      -89,867
sql execute elapsed time                      123,460       56,093      -67,367
PL/SQL execution elapsed time                   3,751        3,626         -125
parse time elapsed                             10,393       10,288         -105
hard parse elapsed time                         8,958        8,948          -10


 wait event

EVENT                                       D_WAITS D_TIMEOUTS d_time_waited(s)
---------------------------------------- ---------- ---------- ----------------
SQL*Net message from client                   -4996          0             4.55
SQL*Net break/reset to client                     0          0                0
SQL*Net message to client                     -4996          0                0
log file sync                                     0          0                0
SQL*Net more data to client                      22          0                0
- index range sacn 은 정렬된 순서로 key를 추출한다. 따라서 Order by를 대신할 수 있다
- index range sacn 에서 index 의 leaf block 을 방문하는 회수 Fetch all 의 회수는에 다라 변함.(단 최소 Fetch Arry Size 값은 2 이다)
- Cost 계산에서는 Fetch Call 회수는 고려되지 않으며, index range scan 의 Cost 는 방문해야할 Block 의 수에 따라 결정된다.
- Leaf Block 의 탐색은 연속적인 Single Block I/O 에 이루어진다.single block i/o 는 random access i/o 이다 .
- 따라서 긴 길의 leaf block chain 을 탐색하는것은 과도한 single block i/o 유발하며 성능이 불리해진다.
- Index 높이는 Index range scan 의 성능에 큰 영향을 주지 않으며, 일단 첫 번째 leaf block 을 찾고 나면 더이상 rootblock 과 Branch Block 을 방문한 필요가 없다
- 즉 Array Size 를 변경한다고 해도 전송해야 할 총량은 변하지 않지만, Fetch Call횟수는 줄일 수 있다.
- 그럼 적당한 운반단위는 얼마가 될까? 적당한게 좋다.
- (네트워크를 통해 전송해야 할 데이터 양에 따라 Array Size 조절 할 필요가 있음)
Pecullar Range Scan
- Oracle 은 조건에 해당되는 Key 값들이 삭제된 것을미리 알고 불필요한 Range Scan 을 피할 수 있는가?
일반적인 상태
SQL> create table t1(c1 int, c2 int);

SQL> create index t1_n1 on t1(c1);

SQL> insert into t1
  2  select level, level
  3  from dual
  4  connect by level <= 10000
  5  ;

10000 rows created.

SQL> exec dbms_stats.gather_table_stats('JIN','T1');

SQL> select /*+ gather_plan_statistics index(t1) */
  2    c1
  3  from t1
  4  where c1 >= 5
  5  ;

select /*+ gather_plan_statistics index(t1) */   c1 from t1 where c1 >= 5

Plan hash value: 1088104427

-------------------------------------------------------------------------------------------------
| Id  | Operation        | Name  | Starts | E-Rows | Cost (%CPU)| A-Rows |   A-Time   | Buffers |
-------------------------------------------------------------------------------------------------
|*  1 |  INDEX RANGE SCAN| T1_N1 |      1 |   9996 |    21   (0)|   9996 |00:00:00.02 |     686 |
-------------------------------------------------------------------------------------------------
삭제 후 Leaf block 탐색 여부 확인.
SQL> delete from t1
  2  where c1 >= 1
  3  ;

10000 rows deleted.

SQL> exec dbms_stats.gather_table_stats('JIN','T1');

PL/SQL procedure successfully completed.

SQL> select /*+ gather_plan_statistics index(t1) */   c1 from t1 where c1 >= 5
  2  ;

no rows selected
select /*+ gather_plan_statistics index(t1) */   c1 from t1 where c1 >= 5

-------------------------------------------------------------------------------------------------
| Id  | Operation        | Name  | Starts | E-Rows | Cost (%CPU)| A-Rows |   A-Time   | Buffers |
-------------------------------------------------------------------------------------------------
|*  1 |  INDEX RANGE SCAN| T1_N1 |      1 |      1 |     1   (0)|      0 |00:00:00.01 |      20 |
-------------------------------------------------------------------------------------------------

SQL> exec dbms_stats.gather_index_stats('JIN','T1_N1');

SQL> exec dbms_stats.gather_index_stats('JIN','T1_N1');

SQL> select /*+ gather_plan_statistics index(t1) */   c1 from t1 where c1 >= 5
  2  ;

no rows selected
select /*+ gather_plan_statistics index(t1) */   c1 from t1 where c1 >= 5

-------------------------------------------------------------------------------------------------
| Id  | Operation        | Name  | Starts | E-Rows | Cost (%CPU)| A-Rows |   A-Time   | Buffers |
-------------------------------------------------------------------------------------------------
|*  1 |  INDEX RANGE SCAN| T1_N1 |      1 |      1 |     1   (0)|      0 |00:00:00.01 |      20 |
-------------------------------------------------------------------------------------------------


SQL> select INDEX_NAME,LEAF_BLOCKS from user_indexes;

INDEX_NAME                     LEAF_BLOCKS
------------------------------ -----------
T1_N1                                    0
- index key 를 delete 하여도 leaf block 의 수는 동일하다. <> dictionary 삭제된 걸로 에서는 조회가 된다!? (삭제후 통계 수집 OK)
- 따라서 index leaf block 의 수도 동일하므로 index key 를 삭제하여도 모든 leafblock 이 탐색 대상이 된다.
- 하지만 key 가 삭제된 경우 실제 Fetch 가 발생하지 않기 때문에 Fetch Call 회수가 줄어든 만큼 성능 개선 효과가 있다.
- index key 를 삭제하여도 leaf block 수 는 줄어 들지 않는다
- leaf block 의 수를 줄이는 방법은 Coalesce, rebuild , shrink 적용해야된다.
SQL> alter index t1_n1 coalesce;

Index altered.

SQL> SQL> select /*+ gather_plan_statistics index(t1) */
  2    c1
  3  from t1
  4  where c1 >= 5
  5  ;


select /*+ gather_plan_statistics index(t1) */   c1 from t1 where c1 >= 5

Plan hash value: 1088104427

-------------------------------------------------------------------------------------------------
| Id  | Operation        | Name  | Starts | E-Rows | Cost (%CPU)| A-Rows |   A-Time   | Buffers |
-------------------------------------------------------------------------------------------------
|*  1 |  INDEX RANGE SCAN| T1_N1 |      1 |      1 |     1   (0)|      0 |00:00:00.01 |       2 |
-------------------------------------------------------------------------------------------------
삭제 전, 후 상태 비교
OWNER                         : JIN            : JIN
INDEX_NAME                    : T1_N1          : T1_N1
INDEX_TYPE                    : NORMAL         : NORMAL
TABLE_OWNER                   : JIN            : JIN
TABLE_NAME                    : T1             : T1
TABLE_TYPE                    : TABLE          : TABLE
UNIQUENESS                    : NONUNIQUE      : NONUNIQUE
COMPRESSION                   : DISABLED       : DISABLED
PREFIX_LENGTH                 :                :
TABLESPACE_NAME               : USERS          : USERS
INI_TRANS                     : 2              : 2
MAX_TRANS                     : 255            : 255
INITIAL_EXTENT                : 65536          : 65536
NEXT_EXTENT                   :                :
MIN_EXTENTS                   : 1              : 1
MAX_EXTENTS                   : 2147483645     : 2147483645
PCT_INCREASE                  :                :
PCT_THRESHOLD                 :                :
INCLUDE_COLUMN                :                :
FREELISTS                     :                :
FREELIST_GROUPS               :                :
PCT_FREE                      : 10             : 10
LOGGING                       : YES            : YES
BLEVEL                        : 1              : 1
LEAF_BLOCKS                   : 0              : 0
DISTINCT_KEYS                 : 0              : 0
AVG_LEAF_BLOCKS_PER_KEY       : 0              : 0
AVG_DATA_BLOCKS_PER_KEY       : 0              : 0
CLUSTERING_FACTOR             : 0              : 0
STATUS                        : VALID          : VALID
NUM_ROWS                      : 0              : 0
SAMPLE_SIZE                   : 0              : 0
LAST_ANALYZED                 : 23-MAR-11      : 23-MAR-11
DEGREE                        : 1              : 1
INSTANCES                     : 1              : 1
PARTITIONED                   : NO             : NO
TEMPORARY                     : N              : N
GENERATED                     : N              : N
SECONDARY                     : N              : N
BUFFER_POOL                   : DEFAULT        : DEFAULT
USER_STATS                    : NO             : NO
DURATION                      :                :
PCT_DIRECT_ACCESS             :                :
ITYP_OWNER                    :                :
ITYP_NAME                     :                :
PARAMETERS                    :                :
GLOBAL_STATS                  : YES            : YES
DOMIDX_STATUS                 :                :
DOMIDX_OPSTATUS               :                :
FUNCIDX_STATUS                :                :
JOIN_INDEX                    : NO             : NO
IOT_REDUNDANT_PKEY_ELIM       : NO             : NO
DROPPED                       : NO             : NO
Nested Loops Join 과 Index Range Scanh
- 문제는 Index Range Scan 과 Nested Loop Join 을 함꼐 사용하면 더 심각해진다.
SQL>  explain plan for
  2    select /*+ leading(t1) use_nl(t1 t2) index (t2) */ *
  3    from t1,t2
  4    where t1.c1=t2.c1;

-------------------------------------------------------------------------------------
| Id  | Operation                   | Name  | Rows  | Bytes | Cost (%CPU)| Time     |
-------------------------------------------------------------------------------------
|   0 | SELECT STATEMENT            |       | 10000 |   429K| 20031   (1)| 00:01:41 |
|   1 |  TABLE ACCESS BY INDEX ROWID| T2    |     1 |    22 |     2   (0)| 00:00:01 |
|   2 |   NESTED LOOPS              |       | 10000 |   429K| 20031   (1)| 00:01:41 |
|   3 |    TABLE ACCESS FULL        | T1    | 10000 |   214K|    12   (0)| 00:00:01 |
|*  4 |    INDEX RANGE SCAN         | T2_N1 |     1 |       |     1   (0)| 00:00:01 |
-------------------------------------------------------------------------------------
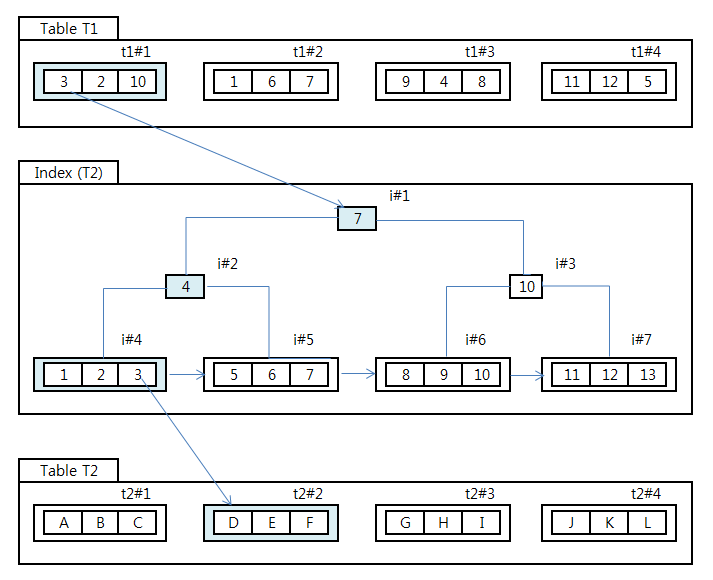
- Table t1 에서 첫 번째 Block(t1#1) 을 읽는다 Logical read 1 증가한다.
- Row 3 의 해당되는 값을 읽고 Table t2 를 찾기 위해 Index 를 root/ branch / leaf block 순으로 방문하고
- Table T2 의 Block(t2#2) 을 방문한다 . Logical read 가 4 증가한다. (root + branch + leaf+ Table)
- row = 2, 3 에 대해 동일한 작업을 반복한다.
- Table t1 에 두번째 되는 Block (t1#2) 을 일고 Logical reads 가 1 증가한다.
- Row = 1,6,7 에 대해 index root + branch + leaf+ Table block 방문을 반복한다.
- 위 과정을 Table t1 에서 조건을 만족하는 Row 만큼 반복한다.
- 넓은 범위를 읽는것이 비효율적인지 알수있다
생성구문
SQL> drop table t1 purge;
SQL> drop table t2 purge;
SQL> create table t1(c1 char(10), c2 char(10));
SQL> create table t2(c1 char(10), c2 char(10));

SQL> insert into t1
  2  select level, 'x'
  3  from dual
  4  connect by level <= 10000
  5  ;


10000 rows created.

SQL> insert into t2
  2  select level, 'x'
  3  from dual
  4  connect by level <= 10000
  5  ;


10000 rows created.

create index t1_n1 on t1(c1);
create index t2_n1 on t2(c1);

10000 rows created.

SQL>exec dbms_stats.gather_table_stats('JIN', 't1');
SQL>exec dbms_stats.gather_table_stats('JIN', 't2');
Oracle Version Oracle 10.2.0.4
********************************************************************************
count    = number of times OCI procedure was executed
cpu      = cpu time in seconds executing
elapsed  = elapsed time in seconds executing
disk     = number of physical reads of buffers from disk
query    = number of buffers gotten for consistent read
current  = number of buffers gotten in current mode (usually for update)
rows     = number of rows processed by the fetch or execute call
********************************************************************************

 select /*+ leading(t1) use_nl(t1 t2) index (t2) */ *
 from t1,t2
 where t1.c1=t2.c1

call     count       cpu    elapsed       disk      query    current        rows
------- ------  -------- ---------- ---------- ---------- ----------  ----------
Parse        2      0.00       0.00          0          0          0           0
Execute      2      0.00       0.00          0          0          0           0
Fetch     1336      0.35       0.34          0      25550          0       20000
------- ------  -------- ---------- ---------- ---------- ----------  ----------
total     1340      0.35       0.34          0      25550          0       20000

Misses in library cache during parse: 1
Optimizer mode: ALL_ROWS
Parsing user id: 59

Rows     Row Source Operation
-------  ---------------------------------------------------
  10000  TABLE ACCESS BY INDEX ROWID T2 (cr=12775 pr=0 pw=0 time=320218 us)
  20001   NESTED LOOPS  (cr=12072 pr=0 pw=0 time=120961 us)
  10000    TABLE ACCESS FULL T1 (cr=711 pr=0 pw=0 time=20102 us)
  10000    INDEX RANGE SCAN T2_N1 (cr=11361 pr=0 pw=0 time=98520 us)(object id 50476)

Elapsed times include waiting on following events:
  Event waited on                             Times   Max. Wait  Total Waited
  ----------------------------------------   Waited  ----------  ------------
  SQL*Net message to client                     668        0.00          0.00
  SQL*Net message from client                   668        8.88          9.21
Oracle Version Oracle 11.2.0.2
********************************************************************************
count    = number of times OCI procedure was executed
cpu      = cpu time in seconds executing
elapsed  = elapsed time in seconds executing
disk     = number of physical reads of buffers from disk
query    = number of buffers gotten for consistent read
current  = number of buffers gotten in current mode (usually for update)
rows     = number of rows processed by the fetch or execute call
********************************************************************************

 select /*+ leading(t1) use_nl(t1 t2) index (t2) */ *
 from t1,t2
 where t1.c1=t2.c1

call     count       cpu    elapsed       disk      query    current        rows
------- ------  -------- ---------- ---------- ---------- ----------  ----------
Parse        1      0.00       0.00          0          0          0           0
Execute      1      0.00       0.00          0          0          0           0
Fetch      668      0.19       0.19          0       3384          0       10000
------- ------  -------- ---------- ---------- ---------- ----------  ----------
total      670      0.19       0.19          0       3384          0       10000

Misses in library cache during parse: 1
Optimizer mode: ALL_ROWS
Parsing user id: 53
Number of plan statistics captured: 1

Rows (1st) Rows (avg) Rows (max)  Row Source Operation
---------- ---------- ----------  ---------------------------------------------------
     10000      10000      10000  NESTED LOOPS  (cr=3384 pr=0 pw=0 time=230183 us)
     10000      10000      10000   NESTED LOOPS  (cr=2681 pr=0 pw=0 time=128745 us cost=20020 size=440000 card=10000)
     10000      10000      10000    TABLE ACCESS FULL T1 (cr=710 pr=0 pw=0 time=13876 us cost=13 size=220000 card=10000)
     10000      10000      10000    INDEX RANGE SCAN T2_N1 (cr=1971 pr=0 pw=0 time=50618 us cost=1 size=0 card=1)(object id 67954)
     10000      10000      10000   TABLE ACCESS BY INDEX ROWID T2 (cr=703 pr=0 pw=0 time=41267 us cost=2 size=22 card=1)


Elapsed times include waiting on following events:
  Event waited on                             Times   Max. Wait  Total Waited
  ----------------------------------------   Waited  ----------  ------------
  SQL*Net message to client                     668        0.00          0.00
  SQL*Net message from client                   668       47.28         55.49
- Version 에 따라 Logical Read 가 크게 개선 되었다.
- 한번 Fetch Call 에서 반복적으로 읽는 Block 은 Logical Reads 가 추가적으로 발생하지 않는다 = Buffer Pinning
- 그러나 읽기작업의 오버헤드가 완전히 없어진건 아니다.
Hints and Parameters
- INDEX : index 사용여부 결정한다. index 이름을 지정하지 않는 경우에는 Optimizer 가장 적당한 index 선택한다.
- INDEX_ASC : index 를 오름차순으로 방문하도록 한다.
- INDEX_DESC : index 를 내림차순으로 방문하도록 한다.
10.2.0.3 부터 가능
- index 선택 모호할 경우 직접 index_range_scan 으로 hint 줄 수 있다..
- INDEX_RS
- INDEX_RS_ASC
- INDEX_RS_DESC
"데이터베이스 스터디모임" 에서 2009년에 "OPTIMIZING ORACLE OPTIMIZER
" 도서를 스터디하면서 정리한 내용 입니다.
- 강좌 URL : http://www.gurubee.net/lecture/3912
- 구루비 강좌는 개인의 학습용으로만 사용 할 수 있으며, 다른 웹 페이지에 게재할 경우에는 출처를 꼭 밝혀 주시면 고맙겠습니다.~^^
- 구루비 강좌는 서비스 제공을 위한 목적이나, 학원 홍보, 수익을 얻기 위한 용도로 사용 할 수 없습니다.